
44 Cart Abandonment Statistics for 2026 (Rates & Reasons)
The average online shopping cart abandonment rate is 70.22%, based on 50 studies compiled by the Baymard Institute. In other words, about seven in ten shoppers who add something to their cart leave without buying.
Below are 44 cart abandonment statistics for 2026, grouped by rate, reasons, checkout length, cost, device, industry, and recovery.
Key takeaways
- The average cart abandonment rate is 70.22% across 50 studies, and 77.38% in Dynamic Yield’s live data.
- Extra costs like shipping, tax, and fees are the top fixable reason, cited by 40% of shoppers who abandon.
- Mobile has the highest abandonment rate at 79.53%, about 10 points above desktop.
- Abandoned cart emails earn $6.77 per recipient on average, the most of any automated email.
- Baymard estimates $260 billion in lost orders could be recovered through better checkout design alone.
Key Cart Abandonment Statistics
| Statistic | Figure | Source |
|---|---|---|
| Average cart abandonment rate (50 studies) | 70.22% | Baymard Institute |
| Cart abandonment rate, trailing 12 months | 77.38% | Dynamic Yield |
| Shoppers who leave because extra costs are too high | 40% | Baymard Institute |
| Shoppers who leave over forced account creation | 18% | Baymard Institute |
| Mobile cart abandonment rate | 79.53% | Dynamic Yield |
| Desktop cart abandonment rate | 69.56% | Dynamic Yield |
| Recoverable lost orders in the US and EU | $260 billion | Baymard Institute |
| Abandoned cart email revenue per recipient | $6.77 | Klaviyo |
| Abandoned cart text conversion rate | 9.1% | Postscript |
What Is the Average Cart Abandonment Rate?
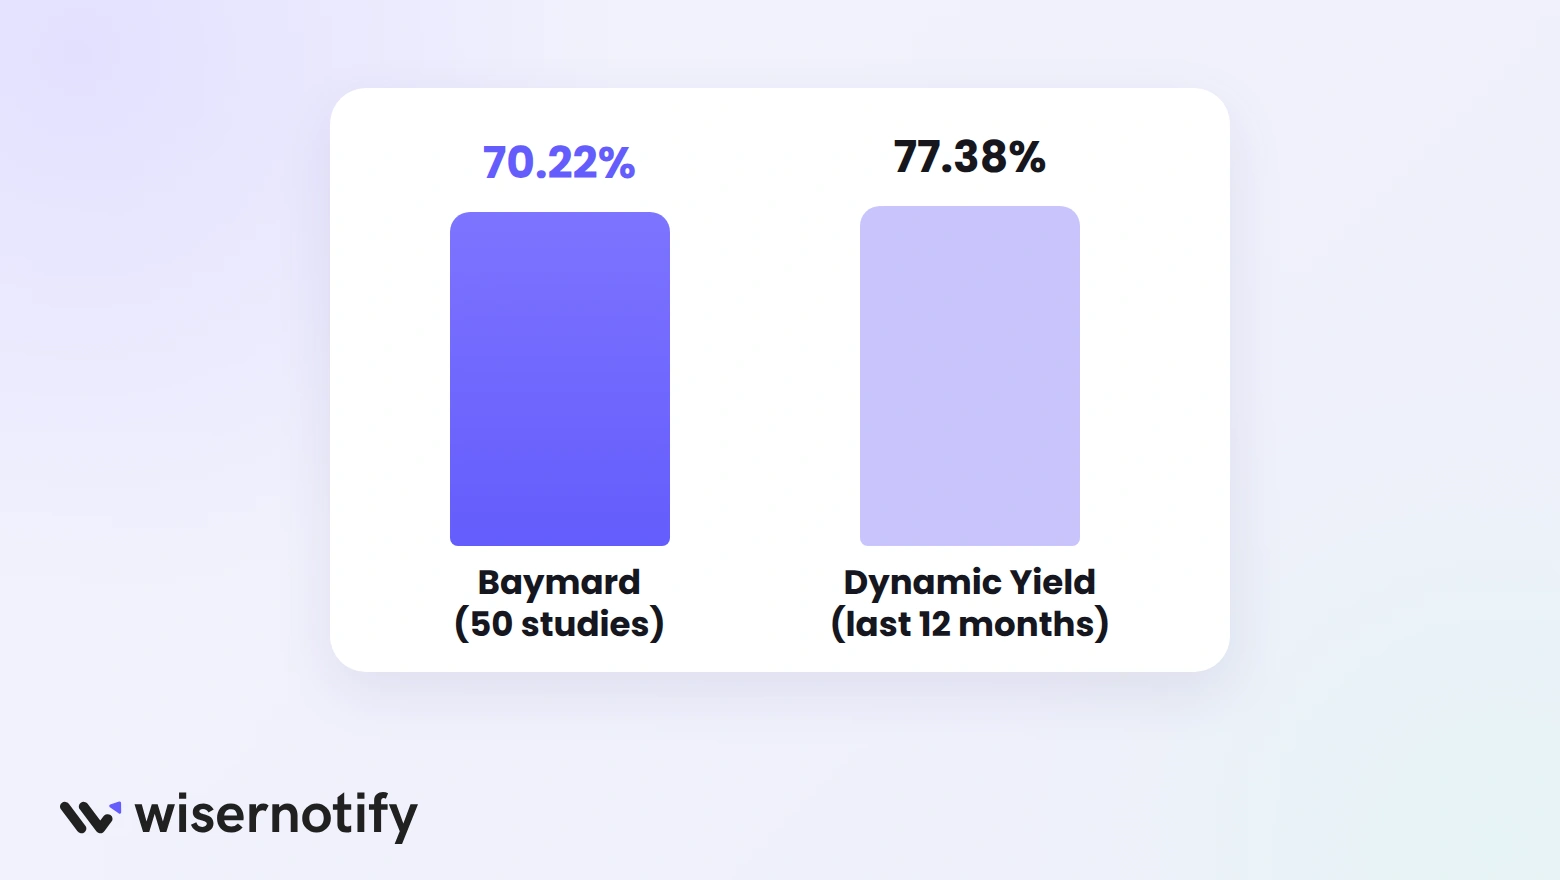
The most-cited number comes from Baymard Institute, which averages 50 cart abandonment studies published between 2006 and 2025. Live platform data from Dynamic Yield runs a few points higher.
- The average documented cart abandonment rate is 70.22%, calculated from 50 separate studies.
- Baymard last updated that average in September 2025, adding a 2025 study from Uptain that found a 71.72% rate.
- Across Dynamic Yield's network of retail sites, the cart abandonment rate over the past 12 months is 77.38%.
- The 50 studies range from a low of 55% (Forrester Research, 2010) to a high of 84.27% (SaleCycle, 2020).
- The most recent SaleCycle figure in Baymard's list is 79.53%, from 2023.
The rate has stayed close to 70% for more than a decade, so a store in that range is average, not failing. These online shopping statistics show how much of that browsing never turns into a purchase.
Why Do Shoppers Abandon Their Carts?
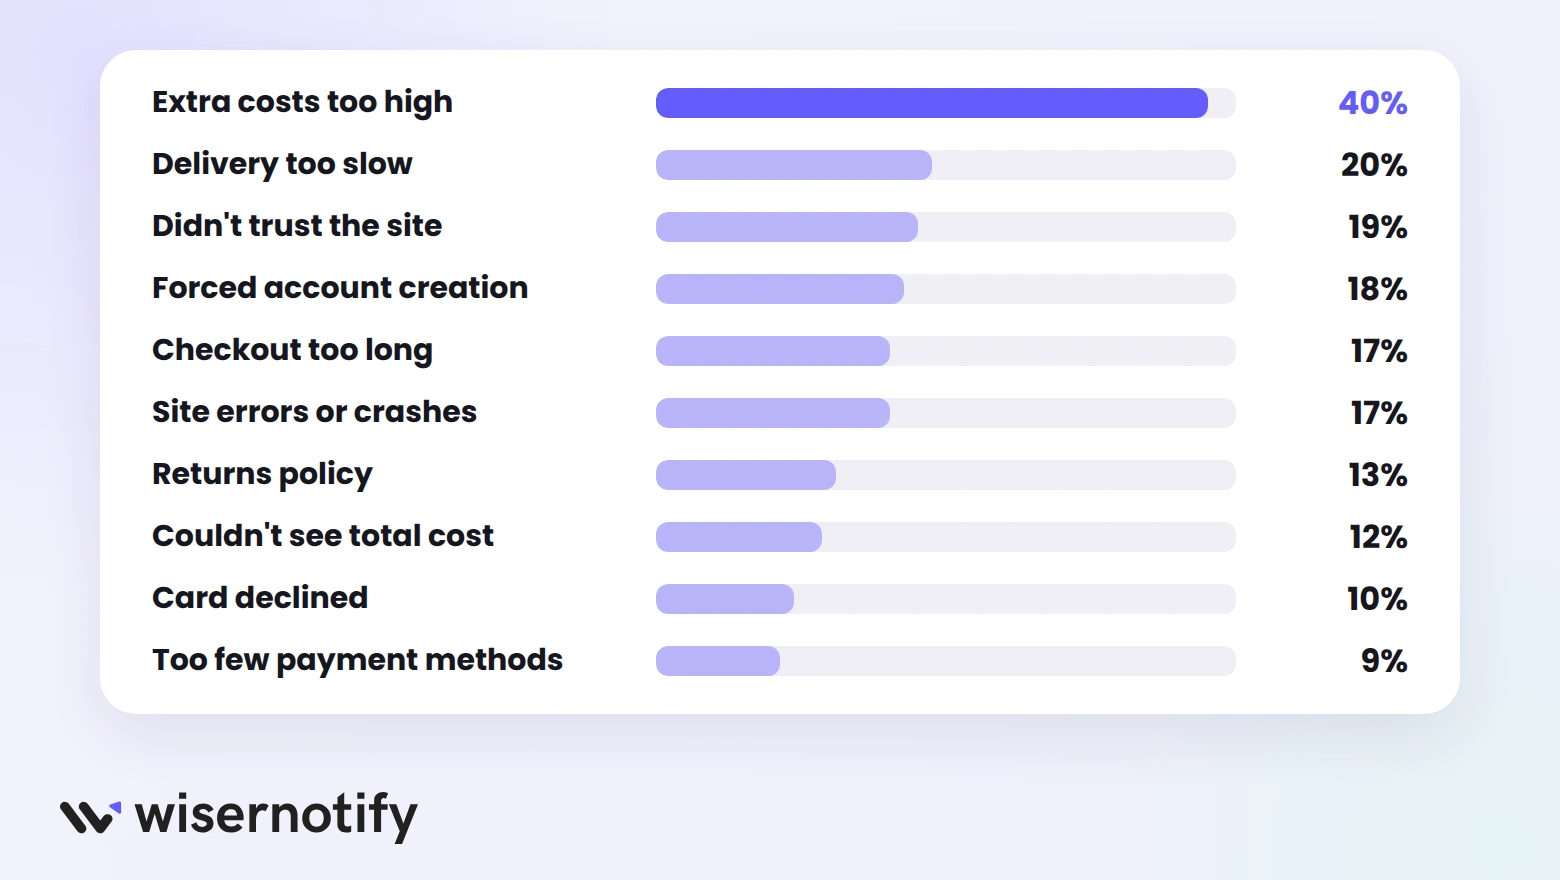
A survey of US shoppers by Baymard found that many carts are simply saved for later. Once those are set aside, the remaining reasons are mostly fixable.
- 42% of US online shoppers have abandoned a cart because they were “just browsing” or not ready to buy.
- 40% of shoppers who abandon for other reasons say extra costs like shipping, tax, or fees were too high.
- 20% leave because delivery was too slow.
- 19% didn't trust the site with their credit card information.
- 18% abandon because the site wanted them to create an account.
- 17% leave because the checkout process was too long or complicated.
- 17% abandon because the website had errors or crashed.
- 13% leave because the returns policy wasn't satisfactory.
- 12% couldn't see or calculate the total order cost up front.
- 10% abandon because their credit card was declined.
- 9% leave because there weren't enough payment methods.
Most of these come down to surprises and friction at checkout. Clear pricing and trust signals near the buy button address several at once, as covered in this guide to ecommerce trust.
That 19% isn't paranoia. Merchants now lose 3.5% of online revenue to payment fraud, and these ecommerce fraud statistics on losses and chargebacks show why shoppers hesitate before typing in a card number.
Build trust & FOMO
Highlight real-time activities like reviews, sales & sign-ups.


How Long Is the Average Checkout?
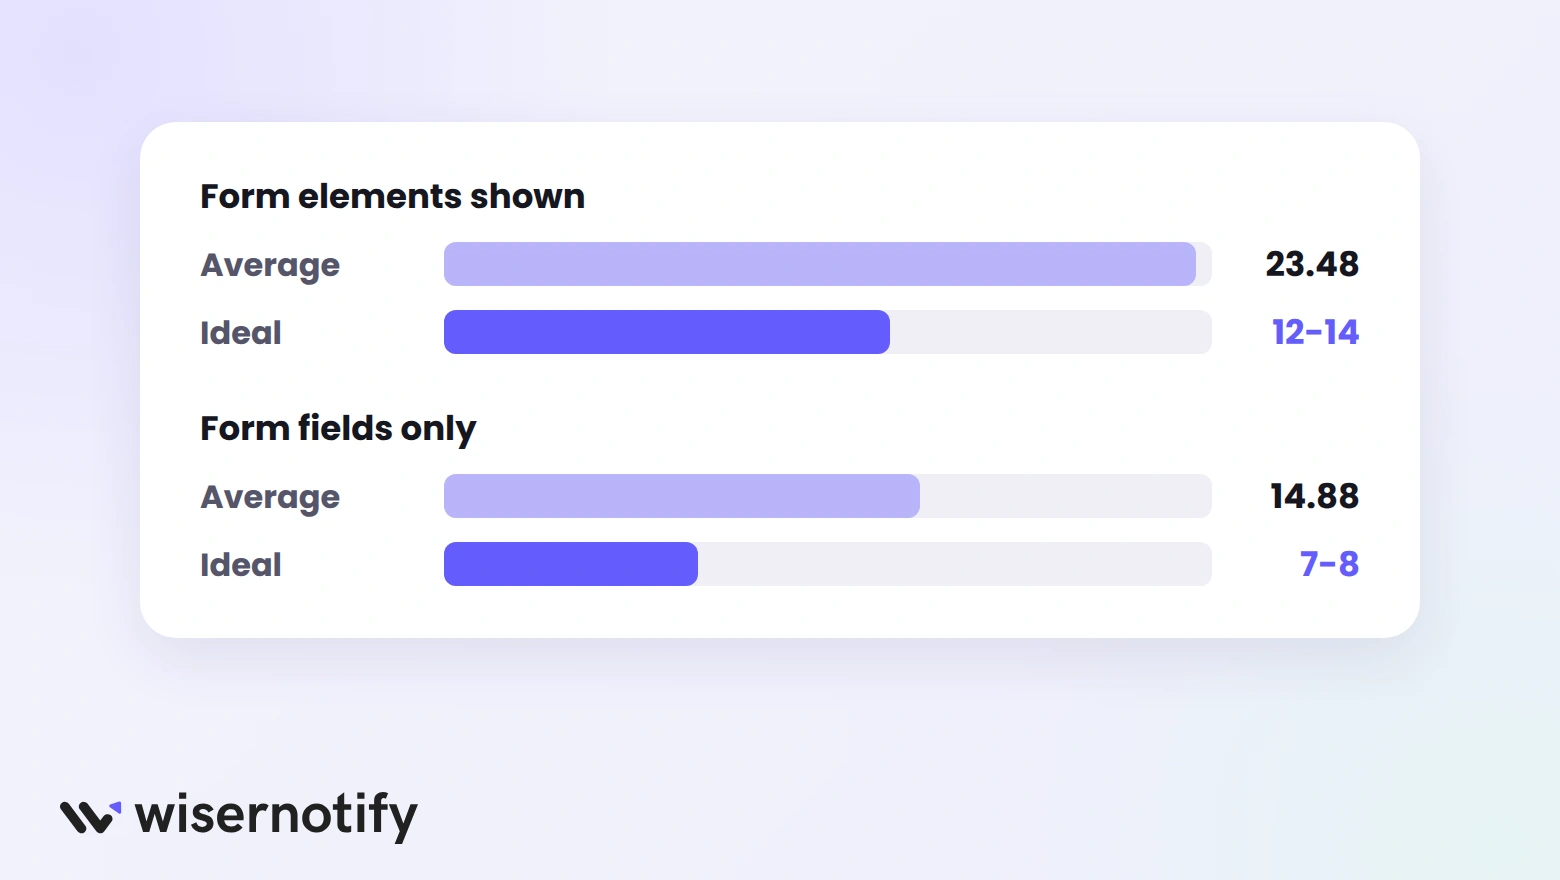
Checkout length is one of the easiest reasons to fix. Baymard's usability testing compares the average checkout with what shoppers need.
- The average US checkout shows 23.48 form elements by default.
- Counting only form fields, the average checkout has 14.88 fields.
- An ideal checkout can be as short as 12 to 14 form elements, or 7 to 8 form fields.
- Most checkouts can cut 20% to 60% of the form elements they show.
For examples of shorter checkouts, see these checkout page design examples.
How Much Revenue Does Cart Abandonment Cost?
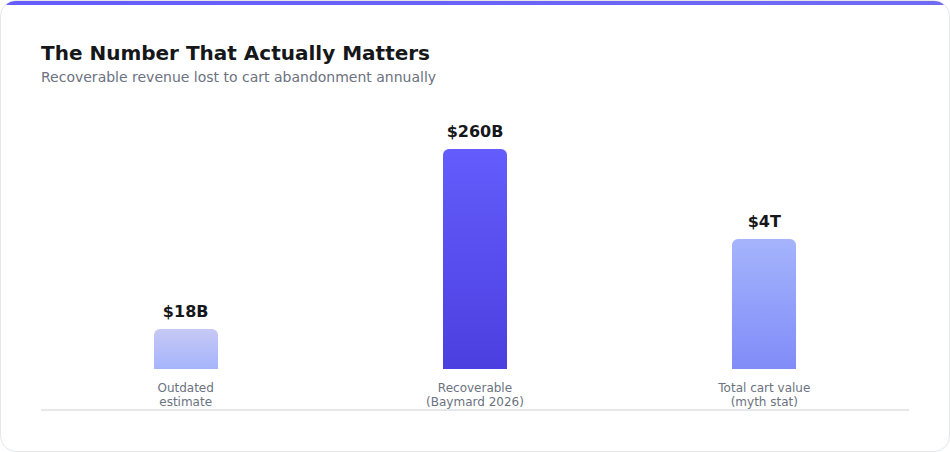
You'll see very different figures for what abandonment costs. The $4 trillion figure counts every abandoned cart, including shoppers who were never going to buy. Baymard's estimate counts only what better checkout design can win back.
- Baymard estimates $260 billion in lost orders are recoverable through a better checkout flow and design.
- That figure is based on combined ecommerce sales of $738 billion in the US and EU.
- Fixing documented checkout usability issues can lift conversion rates by 35.26% for the average large ecommerce site.
- In Baymard's benchmark of 60 leading ecommerce sites, the average site has 39 areas where its checkout could improve.
Which Devices Have the Highest Abandonment Rates?
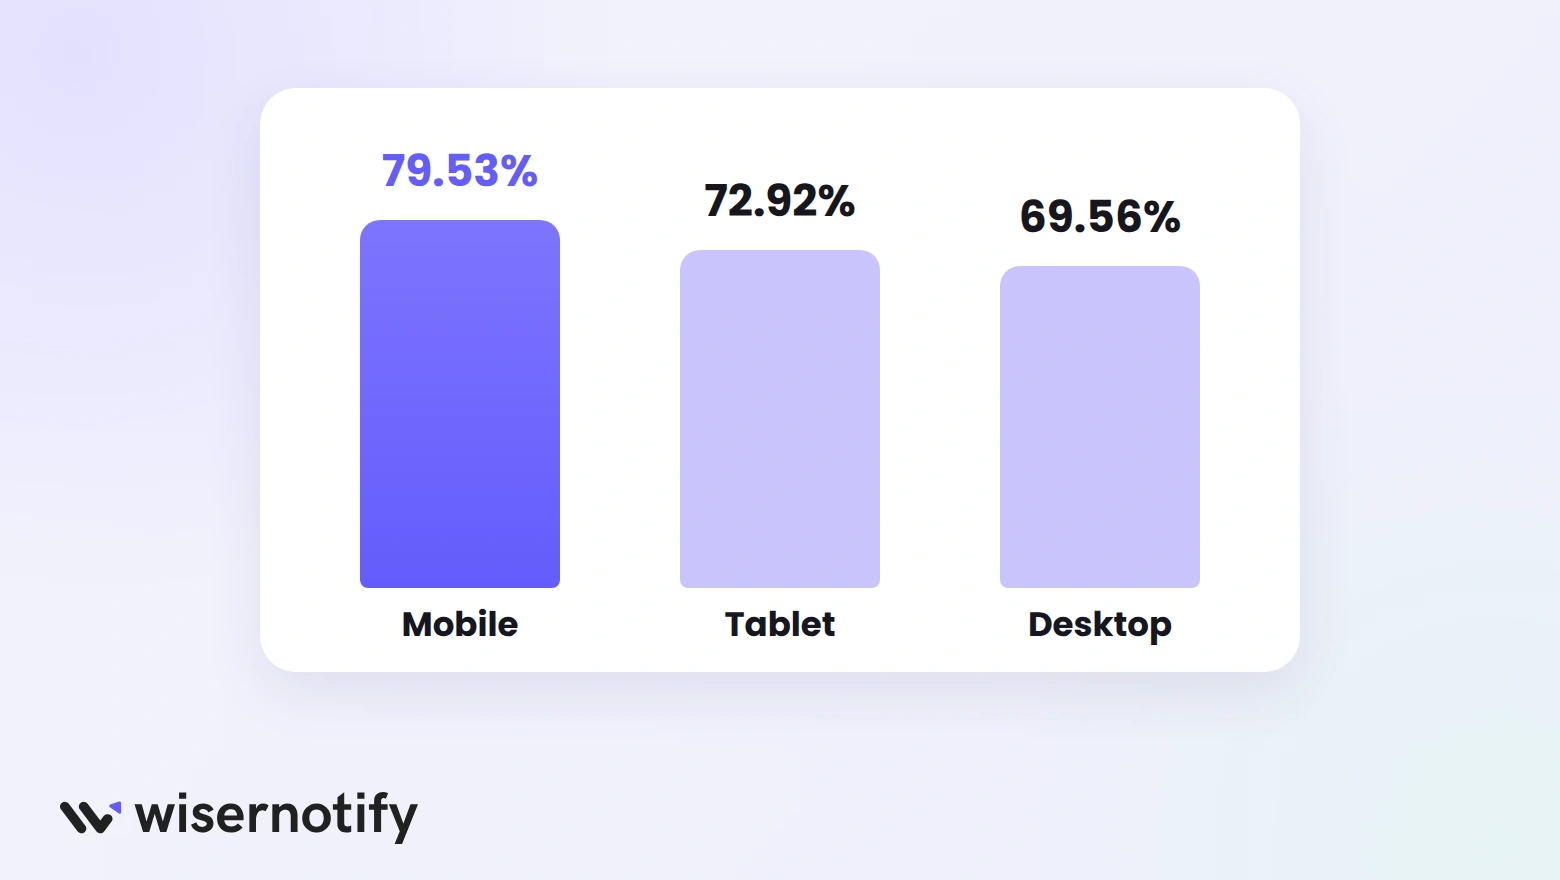
Mobile shoppers abandon far more often than desktop shoppers, mostly because forms and payment are harder on a small screen.
- Mobile has the highest cart abandonment rate at 79.53%.
- Tablet shoppers abandon 72.92% of carts.
- Desktop has the lowest abandonment rate at 69.56%.
That gap of about 10 points makes mobile checkout the first place to look. Digital wallets and fewer form fields help most on small screens. These tactics to increase checkout conversion cover more fixes.
Which Industries and Regions Abandon the Most?
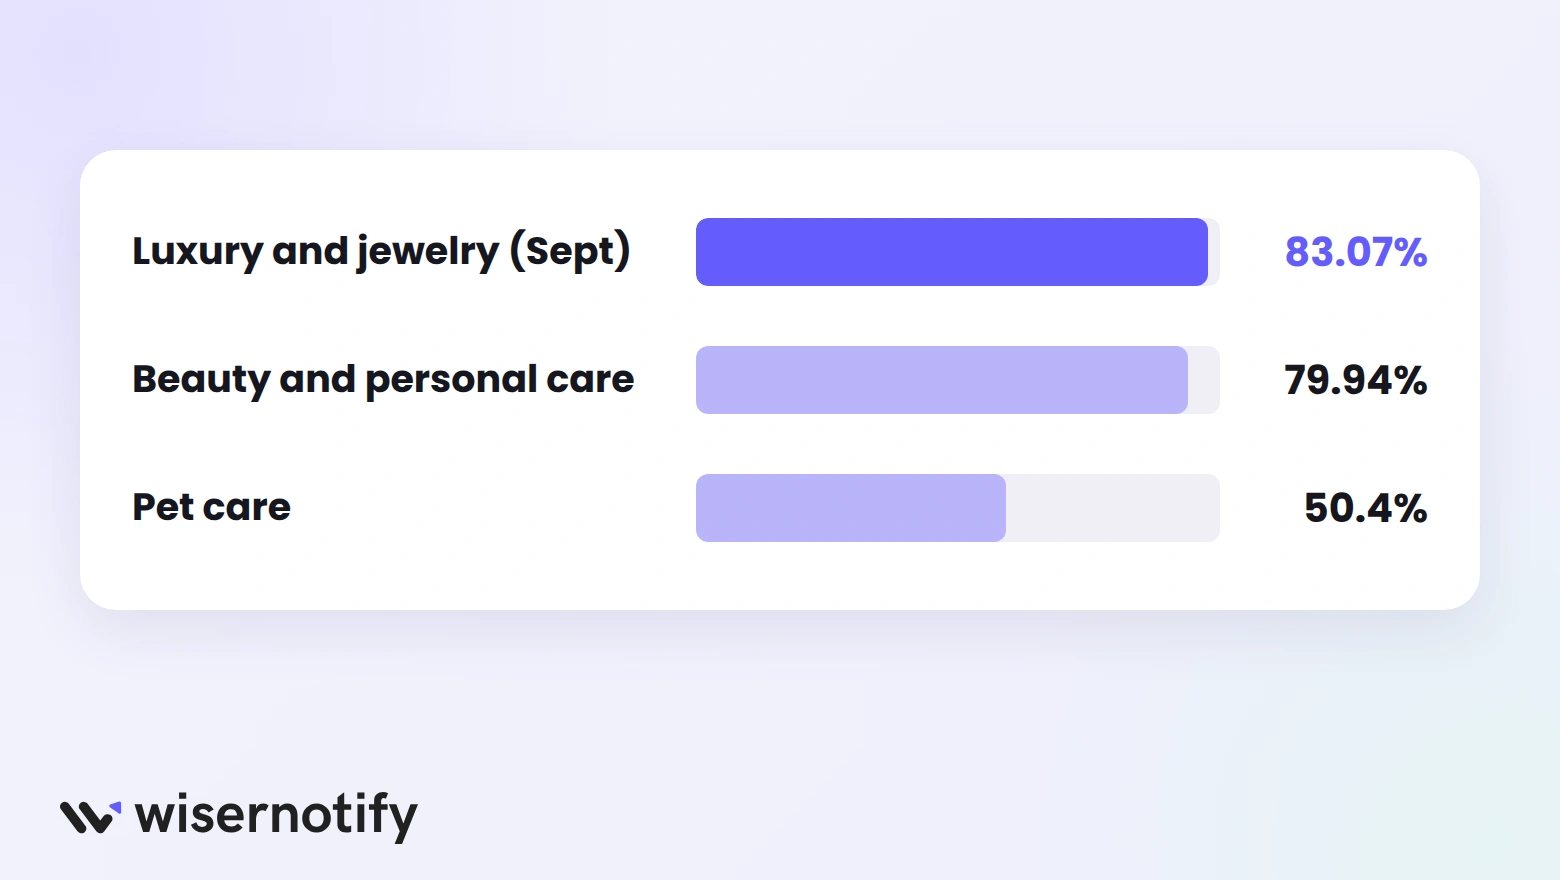
Abandonment varies widely by category and market. Categories with higher prices or more comparison shopping tend to sit at the top.
- Over the past 12 months, beauty and personal care has had the highest abandonment rate at 79.94%.
- Pet care and veterinary services has had the lowest rate at 50.4%.
- In September 2026, luxury and jewelry was the highest category at 83.07%, up 6.26% from August.
- Asia Pacific has the most abandoned carts of any region, at 81.81%.
- Europe, the Middle East, and Africa follow at 78.78%.
- The Americas have the lowest regional rate at 74.32%.
Build trust & FOMO
Highlight real-time activities like reviews, sales & sign-ups.

How Well Do Abandoned Cart Emails and Texts Work?
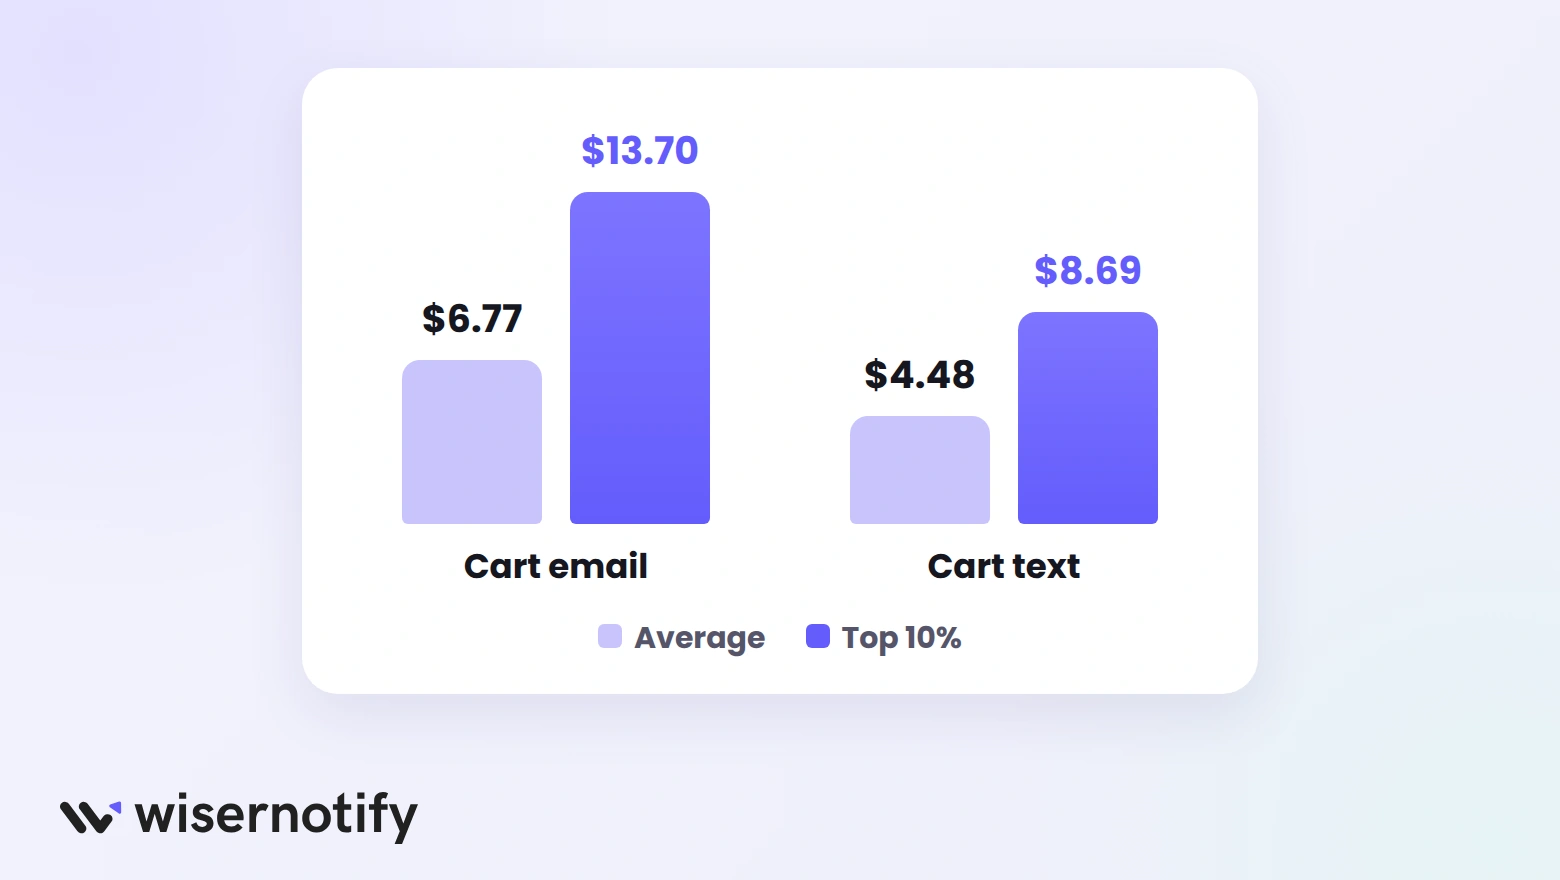
Recovery messages are the most profitable automations a store can run. Benchmarks from Klaviyo (more than 110,000 customers), Postscript, and Omnisend show abandoned cart flows earn the most per recipient of any flow.
- Abandoned cart emails earn an average of $6.77 in revenue per recipient.
- Abandoned cart texts earn an average of $4.48 per recipient.
- The top 10% of brands earn $13.70 per recipient from cart emails and $8.69 from cart texts.
- The average click rate for abandoned cart emails is 6%.
- Abandoned cart texts average a 10.3% click rate.
- The top 10% of brands see click rates of 11.3% for cart emails and 18.5% for cart texts.
- Home and garden and hardware stores earn around $15 per recipient from cart emails, the highest of any industry.
- The top 10% of hardware and home improvement brands earn $35.24 per cart email recipient.
- Abandoned cart text messages convert at an average rate of 9.1%.
- Abandoned cart texts earn $8.11 per message sent on average.
- Abandoned cart and welcome messages together drive 76% of all automation orders.
A three-message sequence is a good starting point: an email two to four hours after abandonment, a text with an offer after 24 hours, and a final message after 48 hours.
Compare tools in this list of cart abandonment software.
How Can You Reduce Cart Abandonment?
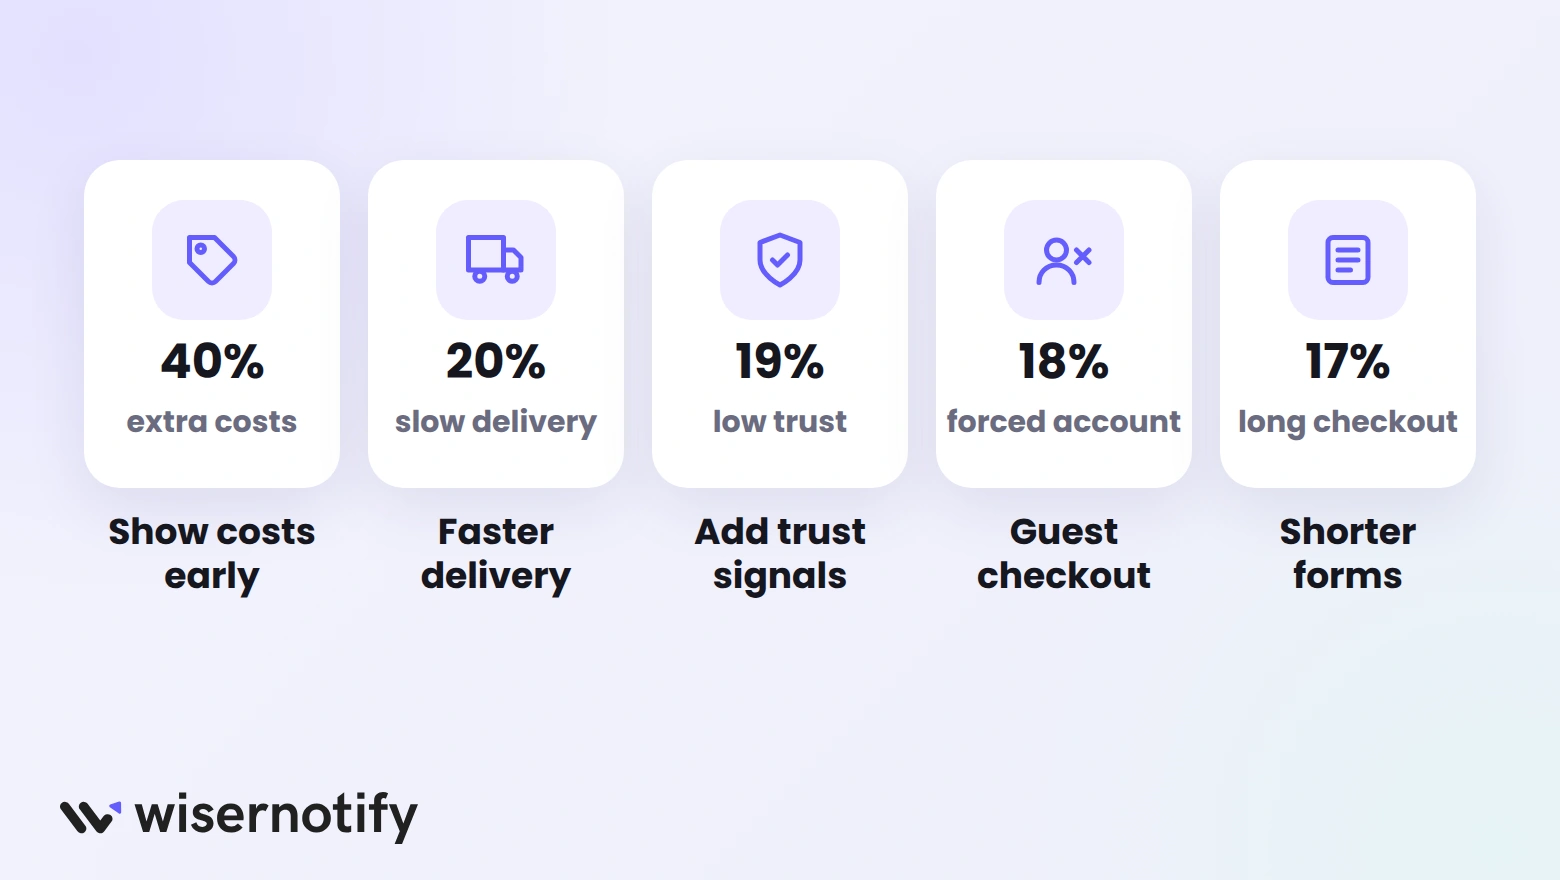
The statistics above point to a short list of fixes, each tied to a top reason shoppers leave:
| Reason shoppers leave | Share | Fix |
|---|---|---|
| Extra costs too high | 40% | Show shipping and taxes on the product page, or offer a free shipping threshold |
| Delivery too slow | 20% | Show delivery dates before checkout and offer a faster option |
| Didn't trust the site | 19% | Add reviews, security badges, and recent purchase notifications near checkout |
| Forced account creation | 18% | Offer guest checkout and ask for an account after the order |
| Checkout too long | 17% | Cut form fields and use address autocomplete |
| Couldn't see total cost | 12% | Show the full order total before the payment step |
Trust is the reason a store can address on every page. Showing recent orders, live visitor counts, and reviews near the cart reassures shoppers who aren't sure about a new store.
WiserNotify shows these as small notifications on product, cart, and checkout pages.
Shoppers who leave without an email address are hard to win back, so capturing emails earlier also helps. See these ecommerce lead generation methods.

Boost Conversion Instantly
Add Social Proof & Urgency to your website
Conclusion
Cart abandonment has held near 70% for over a decade, and some of it will never go away. Many shoppers add items to their cart with no plan to buy that day.
The rest leave for reasons you can fix: surprise costs, slow delivery, low trust, and long checkouts. Fix those first, then follow up with emails and texts to bring the others back.
Sources
Baymard Institute | Dynamic Yield | Klaviyo | Postscript | Omnisend
Frequently Asked Questions
What is the average cart abandonment rate?
About 70%, based on the Baymard Institute’s average of 50 cart abandonment studies.
What is a good cart abandonment rate?
A rate below 70% beats the average across published studies, though it varies a lot by industry and device.
Why do most shoppers abandon their carts?
Extra costs such as shipping, taxes, and fees are the top fixable reason shoppers leave.
Is cart abandonment higher on mobile?
Yes. Mobile shoppers abandon carts about 10 points more often than desktop shoppers.
How do you recover abandoned carts?
Send an abandoned cart email within a few hours, then follow up with a text or a second email.

Krunal Vaghasiya is a marketing tech expert who boosts e-commerce conversion rates with automated social proof and FOMO strategies. He loves to keep posting insightful posts on online marketing software, marketing automations, and improving conversion rates.


 Capterra